The Fee Problem You're Ignoring
When building a ₹5 Crore retirement corpus, every 0.5% in fees matters — over 30 years, 1% more in expense ratio destroys lakhs of rupees in compounding. This is one of the biggest reasons your SIP with inflation assumptions must account for real net-of-fee returns.
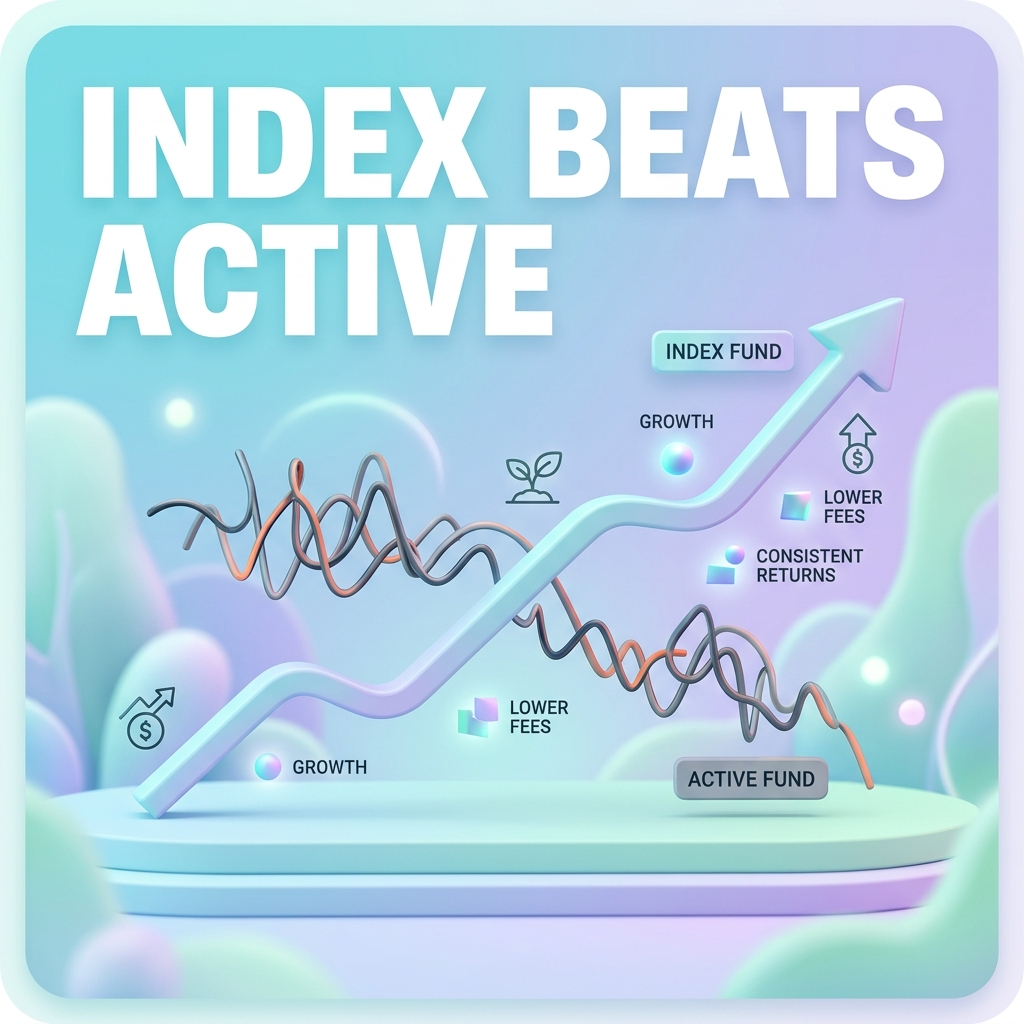
For 20 years, Indian investors have paid active fund managers 1.0-1.5% annually to "beat the market." The evidence now shows that, for large-cap funds, this money is almost entirely wasted.
Index vs. Active: A Direct Comparison
| Feature | Nifty 50 Index Fund | Large-Cap Active Fund |
|---|---|---|
| Strategy | Buy all 50 Nifty companies | Fund manager picks stocks |
| Expense Ratio | 0.05–0.15% | 0.80–1.50% |
| Tracking Error | Minimal | N/A |
| Manager Risk | None | Yes — manager changes affect returns |
| Predictability | High (tracks index) | Low |
| SPIVA 10-yr outperformance | By definition 0% | ~10-15% of funds beat the index |
Source: SPIVA India Scorecard (S&P Dow Jones Indices)
How much do fees cost your FIRE corpus?
Enter your SIP amount and expense ratio in plannF's FIRE Calculator to see the exact rupee cost of 1% extra fees over 25 years.
See a Live DemoThe SPIVA Data: What It Actually Shows
The SPIVA (S&P Indices Versus Active) scorecard tracks how many active Indian mutual funds beat their benchmark index.
Large-Cap Active Funds
| Horizon | % of Active Large-Cap Funds That Underperformed Index |
|---|---|
| 1 year | ~60-65% |
| 3 years | ~75-80% |
| 5 years | ~80-85% |
| 10 years | ~87-92% |
Source: SPIVA India Year-End Report. Large-cap funds compared to Nifty 100 index.
Implication: Over 10 years, 9 out of 10 large-cap active fund managers failed to beat a simple index fund — while charging you 10x more in fees.
Mid-Cap and Small-Cap Active Funds
| Horizon | % of Active Mid/Small-Cap Funds That Underperformed Index |
|---|---|
| 1 year | ~45-55% |
| 3 years | ~55-65% |
| 5 years | ~58-70% |
| 10 years | ~62-75% |
Mid/small-cap managers have historically outperformed more often, but even this edge is closing as institutional money flows in and price discovery improves.
The Math of Expense Ratios Over 30 Years
| Investment | Monthly SIP | Expense Ratio | Corpus at 30 years (12% gross) |
|---|---|---|---|
| Nifty 50 Index Fund | ₹50,000 | 0.10% | ₹1,67,00,000 |
| Active Large-Cap Fund | ₹50,000 | 1.00% | ₹1,48,00,000 |
| Active Large-Cap Fund | ₹50,000 | 1.50% | ₹1,38,00,000 |
| Difference (Index vs 1.5%) | ₹29,00,000 more |
₹29 Lakhs more in corpus just from choosing a 0.10% index fund vs. a 1.50% active fund — without any additional SIP. This is the power of compounding on saved fees.
The FIRE Portfolio Recommendation
| Asset Class | Recommended Product | Expense Ratio |
|---|---|---|
| Large-Cap Equity | Nifty 50 Index Fund | 0.05–0.10% |
| Large + Mid-Cap | Nifty Next 50 / Nifty 100 Index Fund | 0.08–0.15% |
| Mid-Cap | Nifty Midcap 150 Index Fund | 0.15–0.25% |
| Small-Cap | Nifty Smallcap 250 Index Fund (or top active) | 0.25–0.50% |
| Debt | Arbitrage / Liquid Fund | 0.20–0.50% |
For most FIRE investors: 100% of large-cap allocation should be in Nifty 50 index funds. Small-cap is the one category where a strong active fund manager may still justify the fee.
Build your low-cost index fund FIRE portfolio.
Use plannF to model an index fund portfolio vs. active fund portfolio side-by-side and see the exact rupee difference over your target FIRE timeline.
Start Your Free PlanFAQs
1. Is there any category of Indian mutual funds where active management consistently beats the index?
Small-cap funds have shown the most consistent outperformance vs. index, historically. Mid-cap is mixed. Large-cap active funds have essentially no sustained category-level outperformance after fees. For FIRE portfolios, the pragmatic rule: index everywhere except potentially small-cap, where a proven active fund with strong long-term track record (10+ year) may justify the 0.5-1% extra fee.
2. If active funds underperform, why do millions of Indians still invest in them?
Several reasons: (1) Recency bias — investors remember the 2018-2021 period when many active funds significantly outperformed. (2) Distribution incentives — mutual fund distributors earn 0.5-1% trail commission on active funds vs. near-zero on index funds, creating a massive advice bias. (3) Overconfidence in "expert stock-pickers." (4) Many investors don't track net-of-fee returns vs. benchmark.
3. What is "tracking error" and should it worry me?
Tracking error is how much an index fund's return deviates from the index itself. A perfect index fund would have 0% tracking error, but in practice it's always small (0.05-0.15% for top Nifty 50 funds). Look for index funds with the lowest tracking error, not just the lowest expense ratio — the two are related but not identical. Top Nifty 50 funds from UTI, HDFC, Nippon, and Motilal Oswal consistently have <0.1% tracking error.
4. What happens when a star active fund manager leaves their fund?
This is one of the most overlooked risks of active funds. When a high-performing manager leaves (e.g., the historic departures at Quantum or PGIM India), the fund's strategy and returns often suffer for 12-24 months while the new manager adjusts the portfolio. Index funds eliminate this risk entirely — the index itself changes only via SEBI committee decisions, not individual career moves.
5. How does plannF compare an index fund vs. active fund portfolio projection?
In plannF, you can enter two separate portfolio scenarios side-by-side — one with a 12% gross return and 0.1% expense ratio (index), one with 12% gross and 1.5% expense ratio (active). The FIRE Calculator shows the exact corpus difference, FIRE date difference, and lifetime tax difference between the two approaches over your target timeline.