The Flaw of Averages
When we project our retirement corpus on a spreadsheet, we generally use a flat average return. We assume our equity mutual funds will grow at exactly 12% every single year.
But the stock market doesn't work in straight lines. Over a 30-year period, the Nifty 50 might average 12%, but that is composed of years where it is up 30%, and years where it is down -20%.
During your accumulation phase (while you are working and buying SIPs), this volatility is a good thing. A market crash just means you are buying units at a discount.
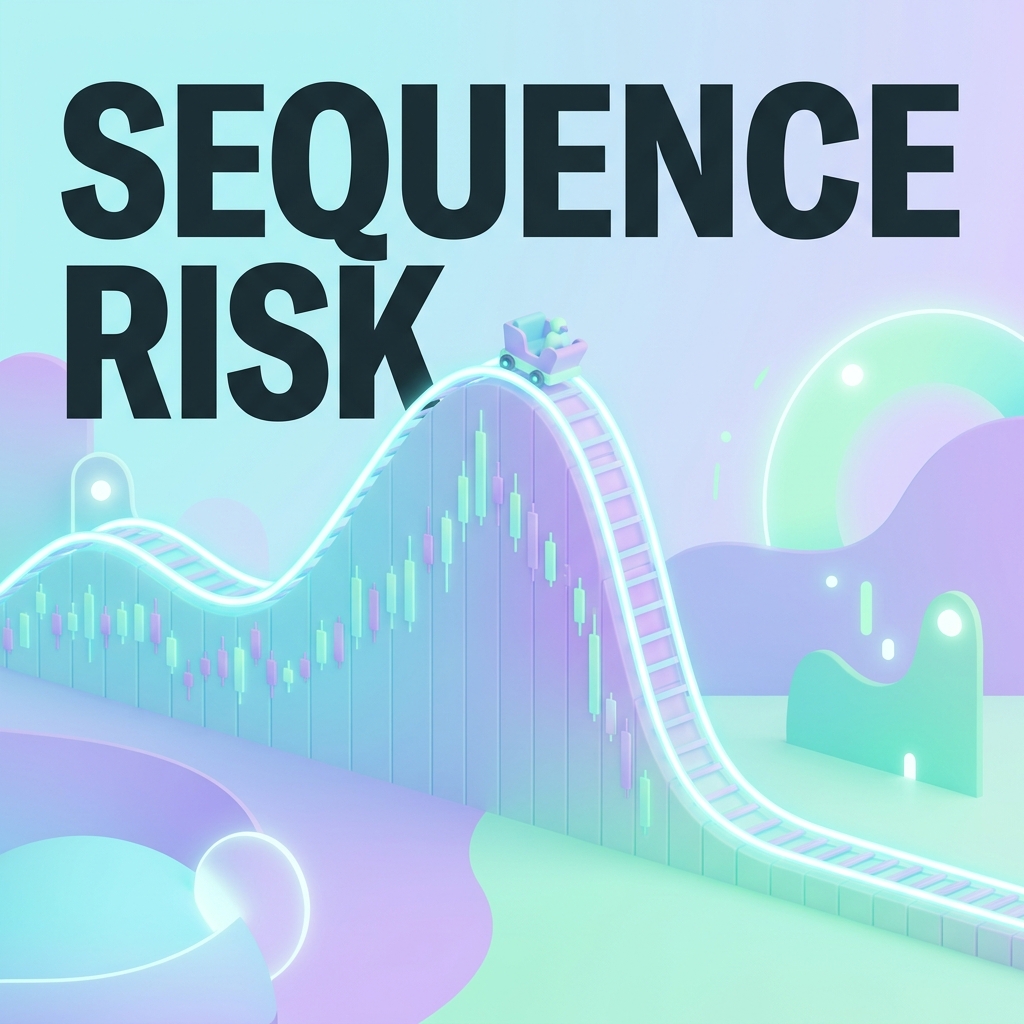
But the moment you retire and start withdrawing money, volatility becomes your biggest enemy. This is known as Sequence of Returns Risk (SRR).
What is Sequence of Returns Risk (SRR)?
Sequence of Returns Risk is the danger that a severe market downturn occurs early in your retirement. If the market crashes in Year 1 or 2 of retirement, you are forced to sell a disproportionately large number of mutual fund units just to fund your basic living expenses.
By selling so many units at the bottom of the market, you permanently cripple your portfolio's ability to compound and recover when the market eventually rebounds.
The Math of Disaster
Let’s look at a terrifying mathematical example to understand why averages lie.
Imagine two retirees, Rahul and Karan. Both retire at 45 with a ₹5 Crore equity portfolio. Both withdraw ₹15 Lakhs a year (adjusted for 6% inflation). Over 30 years, both of their portfolios will experience the exact same average return of 8%.
However, the sequence of those returns is different.
Rahul's Sequence (The Bad Luck):
Rahul retires during a bear market crash (e.g., 2008 or 2020).
- Year 1: Portfolio drops by -15%.
- Year 2: Portfolio drops by -10%.
- Result: Because Rahul had to sell highly depreciated units just to buy groceries, his principal is permanently destroyed. Even when the market surges by 20% in Year 5, he doesn't have enough capital left to benefit. By age 65, Rahul is completely broke. His portfolio goes to zero.
Karan's Sequence (The Good Luck):
Karan retires at the start of a massive bull run (e.g., 2021).
- Year 1: Portfolio grows by +20%.
- Year 2: Portfolio grows by +15%.
- Result: Because Karan's early withdrawals happened while his portfolio was surging, his principal grew faster than he could spend it. The market crashes happen much later, in his 60s, but his safety margin is massive. By age 75, Karan dies with ₹15 Crores in the bank.
Same starting amount. Same withdrawals. Same average return. Completely different lives.
Will your portfolio survive a 2008-style crash?
plannF uses Monte Carlo simulations to test your retirement plan against thousands of randomized, terrible market sequences. See your exact probability of success.
See a Live DemoHow to Defeat SRR in India
You cannot control the stock market. Therefore, you must build defense mechanisms into your asset allocation to survive a bad sequence of returns is especially critical for early retirement in India. Sequence of returns.
1. The Cash/Debt Bucket Strategy
Never put yourself in a position where you are forced to sell equities during a market crash. Build a "Bucket" system:
- Bucket 1 (Liquid): Keep 3 to 5 years of living expenses entirely in Arbitrage Funds, Liquid Funds, and FDs.
- Bucket 2 (Growth): Keep the rest of your portfolio in Equity index funds.
If the market crashes the year you retire, you stop selling equity. You live entirely off your 5-year debt bucket, giving the equity market half a decade to recover.
2. The Bond Tent Strategy
Five years before you retire, gradually shift a large portion of your equity into safe debt (like EPF or PPF). This creates a massive "tent" of safety right at the point of maximum risk (the exact day you retire). Over the next 10 years of retirement, you slowly spend down that debt, naturally letting your equity allocation rise again as the SRR danger zone passes.
3. Dynamic Withdrawals (The Human Element)
If the market crashes by 30%, you do not robotically increase your withdrawals for inflation. You tighten your belt. You cancel the international vacation, delay buying a new car, and temporarily reduce your withdrawal rate to 2.5%. Being flexible is the ultimate SRR defense.
Stress-test your FIRE plan today.
Don't trust a straight-line Excel sheet with your life savings. Use plannF's advanced Monte Carlo engine to bulletproof your retirement against Sequence of Returns Risk.
Start Your Free PlanFAQs
1. Is Sequence of Returns Risk only dangerous at the beginning of retirement?
Yes, the first 5 to 10 years of retirement represent the "Danger Zone." If your portfolio survives this period and experiences average or above-average returns, the compounding effect usually builds a safety margin so large that market crashes in your 70s or 80s won't deplete your corpus.
2. Can I avoid SRR by investing 100% in Debt or FDs?
No. While 100% debt eliminates market volatility (SRR), it exposes you to Inflation Risk. In India, 7% FDs cannot sustain a 30-year retirement against 6-8% lifestyle inflation. You will simply run out of money slowly and predictably rather than quickly. You must balance SRR against inflation using a multi-asset approach.
3. How does the 4% Rule factor in SRR?
The 4% Rule (from the Trinity Study) was specifically designed to survive the worst sequences of returns in US history, including the Great Depression and the 1970s stagflation. However, due to higher Indian inflation, most planners suggest a 3% Safe Withdrawal Rate for Indian early retirees to survive local SRR.
4. What is a Monte Carlo Simulation?
It is a mathematical algorithm used in advanced financial software (like plannF). Instead of projecting a flat 12% return, it runs your retirement plan 1,000 different times, randomizing the sequence of bull and bear markets based on historical volatility. It then tells you: "Your plan succeeded in 950 out of 1,000 scenarios, giving you a 95% Probability of Success."
5. How does a "Bucket Strategy" practically work during a crash?
Imagine you need ₹1 Lakh/month. You have ₹60 Lakhs (5 years) in Liquid Funds, and ₹4 Crores in Equity. The market crashes 30%. You leave the Equity untouched. You set up a Systematic Withdrawal Plan (SWP) from your Liquid Funds. Two years later, the market recovers to all-time highs. You then sell Equity to replenish your Liquid bucket back to ₹60 Lakhs.